Groundwater Monitoring: Why and How to Monitor Groundwater Table?
Why to monitor groundwater table?
Groundwater is a critically important global resource. It requires careful monitoring, protection and management. Monitoring of ground water level (water table) and its recharge has become a mandatory requirement at several places all over the world. A variety of solutions are available ranging from unattended maintenance free monitoring of a single borehole for use by industry to statewide monitoring of hundreds of boreholes from a central location.
How to monitor Groundwater table
Water level measurements from observation wells are the principal source of information. To monitor water level at a particular location, either an existing well/borehole is used or a borehole is drilled down to the aquifer that contributes most to the water table.
A casing pipe is installed in the borehole to prevent the borehole wall from collapsing. At the level of the aquifer, a highly porous filter is provided at the lower end of the casing pipe.
The filter generally consists of a section of slotted pipe covered with geotextile to prevent soil particles from clogging the borehole.
The level of water in such a borehole or well corresponds to the water table at that location. The water level is generally referenced to mean sea level and is known as the elevation of the water table.
How the groundwater monitoring system works
The automatic water level monitoring system is installed in the observation well by geotechnical companies to monitor the water level variation in it. A typical system consists of following components:
- Absolute pressure/Level sensor (model EPP-30V, EPP-40V or EPP-60V) suspended down the observation well, up to the required installation depth. It measure the ware columns above it i.e. height of the water columns above the pressure sensor.
- Automatic datalogger (ESCL-10VT or ESDL-30) to record, store and transmit the data at required intervals, settable at even 5 seconds.
- Interconnecting cable from sensor to datalogger, with Kevlar strain wire
- Temperature sensor inside pressure sensor to measure water temperature
- Barometric pressure sensor inside datalogger to measure atmospheric pressure
- GSM/GPRS modem in the datalogger for data retrieval/transmission with telemetry
The datalogger automatically collects the readings from absolute pressure sensor, barometric pressure sensor and temperature sensor at desired intervals. The software calculates the pressure in terms of water column after correcting for the measured atmospheric pressure and water density.
The datalogger software has features that allows the user to set the sensor calibration coefficients, recording intervals, datalogger or borehole code (identification tag numbers), sensor serial number, real time clock time, transmission time interval, etc.
They are programmed to wake up at the set time and send the collected data to a remote PC/Server/Cloud. The data is stored together with the current date, time and battery voltage, as a data record in internal non-volatile memory of the datalogger.
Case studies — Typical data from a coastal and landlocked State in India

A drop in groundwater table can be observed in water level data from an automatic water level monitoring system installed in the landlocked state of Uttar Pradesh, where the water level is deep.
The water level has gone down by around 1 m to 1.5 m in last 3 years on an average. A typical water level data from Uttar Pradesh is given below. The water table has gone down from 47.8 m in August 2015 to 50.8 m in August 2018. As the water table is deep, we also see lesser recharge of the subsoil or aquifers after monsoon.
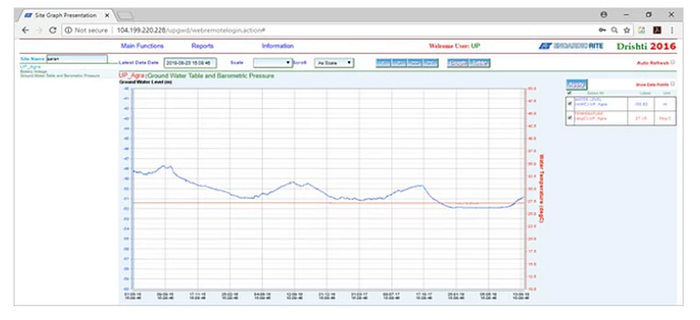
Case Study 2: Water level data from coastal state Andhra Pradesh, India
In Andhra Pradesh, a coastal state in India, the data collected shows that in almost 2.5 years the water level has risen by almost 2 m. After each monsoon, a good rise in water table can be seen which shows how the rain water is recharging the subsoil aquifers, recovering the water table properly. A rainfall gage installed here would have given additional data on amount rainfall in the region and provided a better correlation.